Observability and monitoring in distributed systems
This week, I tackled the essentials of observability and monitoring in distributed systems to ensure you can find issues when they occur.
March Theme: Distributed Systems
This week in our distributed systems series, we're exploring observability and monitoring – the practices that let us see inside our complex distributed systems and understand what's really happening.
So far this month, we've covered scalability, concurrency, fault tolerance, and geographic distribution. Now, let's tackle the crucial question: How do you know if your distributed system is healthy?
What is Observability?
Observability is your system's ability to expose its internal state in a way that helps you answer questions about what's happening inside. It's about making the inner workings visible.
While monitoring tells you when something is wrong, observability helps you figure out why it's wrong – even if you've never seen this particular failure before.
As Charity Majors (co-founder of Honeycomb, an observability startup) puts it: "Monitoring is for known-unknowns; observability is for unknown-unknowns."
The Three Pillars of Observability
Metrics
Numerical representations of data measured over time
Examples: CPU usage, request counts, error rates, latency percentiles
Strengths: Low overhead, great for dashboards and alerts
Limitations: Lose context and detail, pre-aggregated
Logs
Time-stamped records of discrete events
Examples: Application logs, system logs, audit logs
Strengths: Rich context, detailed information about specific events
Limitations: High volume, expensive to store, hard to correlate across services
Traces
Records of a request's journey through your distributed system
Shows the path and timing as a request travels across services
Strengths: Perfect for understanding cross-service interactions
Limitations: Requires instrumentation across all services
Unique Challenges in Distributed Systems
Monitoring distributed systems is fundamentally different from monitoring monoliths:
No Single Source of Truth
Each service has its own logs, metrics, and view of the world
Need to correlate events across many services
Complex Failure Modes
Problems often manifest in unexpected places
The service that's throwing errors isn't necessarily the one with the problem
Data Volume Explosion
More services = exponentially more logs and metrics
Need sampling, filtering, and aggregation strategies
Causality is Hard
Clock drift between machines makes ordering events difficult
"Did A cause B, or did they both happen because of C?"
Building an Effective Observability Strategy
Instrument Everything That Matters
The Four Golden Signals (from the Google SRE book):
Latency: How long it takes to serve a request
Traffic: How much demand is placed on your system
Errors: Rate of failed requests
Saturation: How "full" your system is
Propagate Context
Use correlation IDs across service boundaries
Include user IDs, session IDs, and request IDs in logs
Standardize Your Approach
Consistent logging formats across all services
Common metric naming conventions
Centralized collection and storage
Modern Observability Tools
The observability landscape has exploded in recent years:
Metrics Systems
Prometheus, Datadog, New Relic
Real-time dashboards, alerting, anomaly detection
Log Management
ELK Stack (Elasticsearch, Logstash, Kibana)
Splunk, Graylog, Loki
Distributed Tracing
Jaeger, Zipkin, AWS X-Ray
OpenTelemetry (open standard for telemetry data)
Full-Stack Observability
Honeycomb, Lightstep
Practical Observability Tips
Start Simple
Begin with basic metrics and expand
Get your logging basics right before pursuing complex solutions
Instrument at the Right Level
Too much data is as bad as too little
Focus on high-value services first
Design for Debugging
Add context to logs and traces that will help future-you
Log at boundaries (service entry/exit points)
Watch for Alert Fatigue
Too many alerts = ignored alerts
Alert on symptoms, not causes
Use severity levels appropriately
The Deep Dive
This week's deep dive recommendation is the free e-book "Distributed Systems Observability" by Cindy Sridharan. It provides excellent practical guidance on building observable distributed systems.
Final Thoughts
Observability isn't just a technical practice, it's a mindset. The best distributed systems are designed with observability in mind from day one, not bolted on afterward.
Remember: You can't fix what you can't see, and you can't improve what you can't measure. Invest in observability, and your future self will thank you when that 2 AM production incident hits.
What observability tools do you use and have you found most valuable in your distributed systems? Reply to this email, I'd love to hear your experiences!
Thank you!
If you made it this far, then thank you! Next week we will start on our April topic, Mentoring!
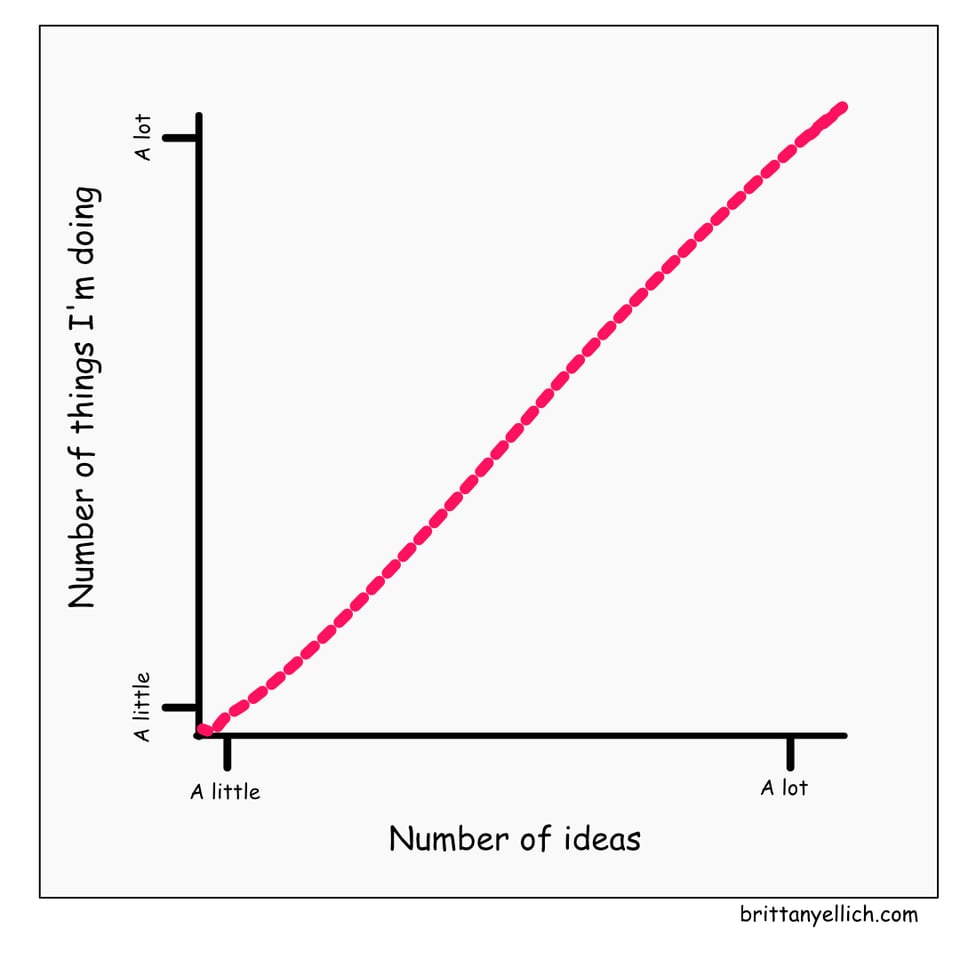
Here’s a silly web comic I made this week:

Add a comment: